
sled
github repo
introduction
documentation
motivating experiences
book shop
support sled
blog
API considerations
error handling in Rust
jepsen-proof engineering
theoretical performance guide
sled theoretical performance guide

![]()


This guide covers timeless ideas that are helpful to keep in mind while working with systems where performance matters. Many of these ideas are fairly “durable” and will apply regardless of what hardware, programming language, operating system, or decade you are working in.
Stay tuned for follow-up articles that will drill into hardware and more Rust-specific techniques.
Skip to the table of contents if you don’t like intros.
There’s some foul language in here. Enjoy!
executive summary
- make it work, then make it pretty, then make it fast
- only do things that are necessary for correctness and safety
- your engineers will burn out, leave your team, and relentlessly shit talk you if they don’t make their code pretty and low-friction to work with
- align all latency-throughput queuing positions for everything in the serial dependency graph, or you will get worst-of-all-worlds latency-throughput behavior, increasing latency and lowering throughput
- if something necessary can be done in the background without blocking, queue it up for eventual batch processing to improve cache performance
- look at allocation lifetime using DHAT, avoid short-lived allocations and ensure that long-lived allocations employ time-space trade-offs that consume plentiful resources instead of scarce ones where possible
- seriously, it’s always your fault if your engineers quit.
- performance happens naturally when engineers love the codebase and they are aware of which parts of the system can be sped up
- before wasting time optimizing things that don’t matter, we can easily test whether optimizing could be useful at all by adding delays or deleting relevant code to see what the impact of infinite optimization would be
- by default your machine will randomly change your cpu frequency, yank processes across cores and sockets, and generally make measurements deceptive and non-reproducible. we can control this behavior. if you don’t account for this behavior, your measurements are not sound justifications for code changes
- wait, why does an executive care about performance, anyway?
non-executive introduction
Ok, now that the executives are gone, it is time to party.
Let’s put on some nice music.
Take a deep breath.
Let it out.
The year is 2020. and we are utterly fucked.
Supposedly we are here reading this article because we “like computers” or something but let’s be clear about one thing - you’re not here because of that. I know. You know. We all know. You couldn’t give two fried pennies about computers if they didn’t help you feel the things you so desperately need to feel.
You’re here, ultimately, because of control. Your entire life is entombed in an elaborate, entirely abstract labyrinth of machines that define so many aspects of every moment of your waking life. You’re here to better understand the prison you find yourself within. You’re here to sympathize with the machine.
While you will only seep ever more deeply into this morass of gold and glass, you have the power to turn your captors into familiar friends. You have the power to make the machines into the only friends you will ever need. You are here to abandon the organic and the analogue. There is nothing for you on the other side of your window. As you lounge (please fix your posture now) in your designated quarantine pit, gazing listlessly into the LED mesh while biding your time, I invite you to join me - your newest simulated human experience - on a once-in-a-lifetime adventure into the bowels of the machine through which you experience joy and place orders for more toilet paper.
It begins today.

This guide contains basic information for getting started with performance-sensitive engineering. I think most folks will learn something new. I know I have. And, part of why I wrote this is to have a single place with a memorable URL where I can return to when I forget most of this stuff. More importantly, when I unfurl fiery screeds in random internet comments I want to have an intimidating reference to which I can mercilessly link.
I initially wrote this guide for the Rust ecosystem, where many people are now trying their hands at optimization for the first time. But nearly all of this document applies to general programming, with a few of the hardware effects mentioned being specific to x86 and ARM circa 2020. Linux is assumed, because that’s what the overwhelming majority of server workloads run today.
This guide brings together ideas from systems engineering, systems theory, psychology, hardware, queuing theory, statistics, economics, distributed systems, concurrency and philosophy of science with the goals of helping you to be less of an asshole and write code that tends to improve the metrics you care about.
Performance is about being thoughtful about the metrics that matter to us and allowing ourselves to be aware of them while making decisions.
These materials are based on Tyler Neely’s Rust workshop content, and have been inspired by the writings of Dmitry Vyukov, Mark Callaghan, Brendan Gregg, Martin Thompson, Pedro Ramalhete and others.
shameless, emotionally annihilating begging
My workshops have been the primary means of supporting sled development costs. Unfortunately, the workshops are now on hold due to coronavirus concerns. If you feel like this information is useful, please consider supporting my efforts to share knowledge and productionize cutting edge database research with implementations in Rust :)
I love you.
contents
Let’s kick this shit up! Here’s what it’s gonna look like…
- principles
- e-prime and precise language
- metrics: latency, throughput, utilization and saturation
- experimental design
- concurrency and parallelism
- amdahl’s law
- universal scalability law
- trade-offs
- scouting ahead
IT BEGINS
principles
You are not a Bayesian homunculus whose
reasoning is “corrupted” by cognitive biases.

You just are cognitive biases.
The first thing to consider is that our minds are pure shit and everything we know is wrong. We must accept our fallibility before embarking down the path to fast-as-fuck machinery.
We build towers of assumptions that are bound to specific contexts, and when the conditions that caused us to form these beliefs change, we tend not to revisit the now-invalidated beliefs. Cache invalidation is hard when we are so rarely aware of the dependency graphs of what we believe.
So, we measure. Even when we’re convinced that we’re right. Because we are always out of sync with reality, and we are fundamentally incapable of altering this fact. But we can be responsible in the face of that.
Corollary: allow yourself to be wrong. Allowing yourself to be wrong with yourself, your collaborators, and in public is a key optimization for learning faster and building better things with less effort and in less time.
Luckily for us, machines tend to be somewhat amenable to measurement. We built them that way. Indeed, constructing them to be somewhat measurable in the first place was the only way we were able to assemble them at all despite our innumerable shortcomings. We took the predecessor to your current machine, chose some metrics to improve, made a huge number of mistakes while continuing to measure, and occasionally we got lucky: the metrics we cared about improved enough to alter production lines, crystallizing our occasionally successful results into new production processes that eventually put your machine in front of you.
We must measure.
The only thing that matters is that real programs on real hardware see real improvements in relevant metrics like total cost of ownership, responsiveness, etc… If a metric doesn’t help a human, it’s just a vanity pursuit that may make the important metrics worse due to under-investment.
We must select our measurements with care. Our time is precious.
By making decisions that are considerate of available data, we are able to cut through so much bullshit. We have so many ideas that our experience tells us should cause our code to improve, but it simply isn’t true when we actually measure. Code changes that made your Java, C++, Haskell or JS programs faster may not make Rust any faster. Don’t make Rust code ugly just because some program you wrote in the 90s worked better with manual loop unrolling. Compilers change, in many ways for the better.
Don’t be macho. Make decisions while having real data on-hand and limit the damage of hubris.
e-prime and precise language
So many aspects of performance-critical engineering can be highly contextual and may vary wildly from one machine to another. It helps to avoid the verb “to be” and its conjugations “is”, “are” etc… when describing observations.
When we say something “is” something else, we are casually equating two similar things for convenience purposes, and we are lying to some extent. By avoiding false equivalences (usually easily spotted through use of “is”, “are” etc…) we can both communicate more precisely and we can allow ourselves to reason about complexity far more effectively. Situations that may seem completely ambiguous when described using “to be” phrases are often quite unambiguous when taking care to avoid false equivalences. This general form of speech is known as E-Prime.
Don’t say “lock-free queues are faster than mutex-backed queues”, say “on hardware H with T threads running in tight loops performing operations O, our specific lock-free queue has been measured to achieve a latency distribution of X1 and our specific mutex-backed queue has been measured to achieve a latency distribution of X2.” It’s likely your lock-free queue will sometimes perform worse than a well-made mutex-backed queue given certain hardware, contention and many other factors. What does “perform worse” even mean? Different use cases will have a different mix of available resources. A particular lock-free implementation that is higher throughput under high contention may use more memory, have a slower median latency, be buggier, and take longer to create than a mutex-backed structure that does not need to allocate or perform RCU. Is this ever going to be high contention, anyway? Are you sure you’re writing this for the benefit of your system, or because you want to be macho at work?
When we speak about comparative metrics, it is also important to avoid saying
commonly misunderstood things like “workload A is 15% slower than workload B”.
Instead of saying “faster” it is helpful to speak in terms of latency or
throughput, because both may be used to describe “speed” but they are in
direct opposition to each other. Speaking
in terms of relative percentages is often misleading. What does
A (90) is 10% lower than B (100) mean if we don’t know their actual
values? Many people would think that B is 1.1 * A, but in this case,
1.1 * 90 = 99. It is generally better to describe comparative measurements
in terms of ratios rather than relative percentages.
The phrase workload A is 20% slower than workload B can be more clearly stated
as workload A was measured to have a throughput of 4:5 that of workload B.
Even though many people will see that and immediately translate it to “80%” in
their heads, the chances of improperly reasoning about the difference are
lower.
When we make our communications less ambiguous, we have more brain cycles available for speeding things up based on clarified mental models. The time we spend can be better spent because it can be more precisely targeted.
metrics
Performance metrics come in many shapes and sizes. Workloads will have a few metrics that matter far more than others. Every workload has its own set of priorities and available resources.
It’s at this point that I’m obligated to bash benchmarketing, but honestly it’s often an important tool for projects to see success - you just need to be clear about what your metrics actually are. Don’t trick people. Give people the means to reproduce your findings.
Many systems performance metrics boil down to these:
- latency - the time that an operation takes
- throughput - how many operations can be performed in some unit of time
- utilization - the proportion of time that a system (server, disk, hashmap, etc…) is busy handling requests, as opposed to waiting for the next request to arrive.
- saturation - the extent to which requests must queue before being handled by the system, usually measured in terms of queue depth (length).
- space - whoah.
At higher scales, these metrics become factors in major concerns like:
- total cost of ownership
- how many servers do I need to pay for to get my shit done?
- how many hours do engineers spend taking care of this shit?
- how much power does this shit draw?
Quick aside - as of 2020, cloud providers tend to under-charge for compute (ec2, lambda, etc…) in an effort to increase your reliance on their more expensive storage products. A concept of “data gravity” exists where your compute must stay where the storage is. You can’t move your compute to a different cloud provider if your data is stuck in the old one. And egress traffic is taxed heavily to make it more painful to get out. And where your compute exists, more data is likely to be produced, increasing the gravitational field. Make sure your back-of-the-napkin calculations for running infrastructure somewhere take account of the storage costs primarily. Engineers love using the fancy hosted databases like Spanner, but the cost per byte stored is astronomical. BE AWARE.
In trying to determine how many servers do I need to pay for to get my shit done, we need to consider latency, throughput and required space (memory and storage).
latency vs throughput
Latency and throughput considerations are often in direct contradiction with each other. If we want to optimize the throughput of a server, we want to increase the chance that when a server is finished processing one request that it already has another one lined up and ready to go. 100% utilization means that the server is always doing useful work. If there is not work already waiting to be served when the previous item completes, the utilization drops, along with the throughput. Having things waiting to go in a queue is a common way to increase throughput.
But waiting (saturation) is bad for latency. All other things being equal, sending more requests to a system will cause latency to suffer because the chance that a request will have to wait in line before being served will increase as well. If we want to minimize the latency of a server, we want to increase the chance that there is an empty queue leading into it, because waiting in that queue will slow down each request.
Latency vs throughput is a fundamental relationship that has tremendous consequences for performance-sensitive engineering. We are constantly faced with decisions about whether we want our requests to be fast, or if we want the system to generally handle many requests per second, with some being quite slow due to waiting so long in the queue.
If you want to improve both latency and throughput, you need to make the unit of work cheaper to perform.
Different systems will have different relationships between utilization and saturation. Network adapters are often designed to be able to keep receiving more and more work and avoid saturation until relatively high utilization. Other devices, like spinning disks, will start saturating quite quickly, because the work causes other work to get slower by needing to drag the disk spindle to another physical location before it’s able to handle the request. Here’s a place where smart scheduling can make a huge difference for the relationship between utilization and saturation. Most modern storage devices based on flash memory are essentially distributed databases where every 32mb is a different shard, so you can get a lot of throughput without immediate negative saturation by keeping the queue depths pretty deep, so more of the distributed chips in the device can do work at once.
A critical insight is that if you have a system that you wish to optimize for low latency, it is helpful if the subsystems that it depends on are also optimized for latency. If you are serving user requests where you want to minimize response time, you probably want to avoid having that response depend on an analytical database tuned for batch performance instead of low latency. If you want to process trillions of records in some low amount of time without caring much about the time to process a particular record, you probably want to rely on systems that have been tuned for throughput at the expense of latency.
All systems have specific latency-throughput trade-offs. When your system depends on subsystems in the critical path where different latency-throughput trade-offs were made, your overall system will behave worse. If you force a latency-bound user-facing response to go through a kafka queue before their web browser loads the result, you are introducing a throughput-bound dependency into the critical path of a latency-bound workload, and the result will be a worse experience. We should use low-latency dependencies in the critical paths of low-latency workloads. We should use high-throughput dependencies in the critical paths of high-throughput workloads. Mixing and matching systems in our critical paths without evaluating their queuing characteristics is likely to result in terrible performance.
Measure what’s happening and keep your queuing behaviors aligned and your system will fly.
Under light load, throughput-bound systems can sometimes scale down to reduce buffering and achieve lower latency at lower loads. Andrea Lattuada mentioned a great example of an auto-tuning system to me: a throughput-oriented system can take the entire queue of new requests, process them in a batch, and generally keep picking the queue length as the batch size where possible. This auto-tunes the batch size to be low (reducing latency) when there is a small request volume coming in. This yields nice low latency requests when the volume of requests is low, but allows the system to scale up and take advantage of batch optimizations as the request rate increases. Latency suffers as load increases, because in this case, latency is not a high priority.
An auto-tuning low-latency system must scale something other than the queue length when throughput increases if it is going to keep maintaining low latency. Low-latency is dependent on keeping the the amount of time waiting in a queue beneath a desired threshold. So, instead of increasing the batch size, we must increase the amount of parallelism by using more cores, more servers, etc… However, as Amdahl’s Law and USL show, we can only parallelize a program by a certain amount, and the very act of parallelization will impose additional costs which could negate any possible gains from parallelization.
It is important when building a system to be aware of whether your goal is to keep requests processing at low-latencies or at high-throughputs, because this should have a huge impact on your design, your dependencies, your scaling techniques, etc…
Be aware of where your system stands on this spectrum.
Further reading:
- http://www.brendangregg.com/usemethod.html
- Systems Performance: Enterprise and the Cloud by Brendan Gregg (buy the book just to read chapter 2: Methodology)
- Quantitative Analysis of Computer Systems by Clement Leung - awesome intro to queue theory.
measuring latency
In the process of satisfying a request of some sort, a system will often rely on other systems. A database relies on a kernel to schedule its threads onto CPUs and provide access to storage. We can learn about what causes a database to be slow by learning about what causes its subcomponents and interactions with other systems to be slow.
If you’re measuring latency for a large number of requests, there are a number of ways that you can derive meaning from measurements. People often rely on averages to make sense of a large number of measurements. But the average is not very interesting for our highly discrete computer systems because it hides the impact of outliers and gives us no insight into the distribution of data. Things like normal curves and t-tests do not apply for data which do not follow normal distributions. Determining what our distribution looks like at all is a vital part of our work.
We usually use histograms so that we can understand the distribution of our data. The 0th percentile is the minimum measurement. The 100th percentile is the maximum measurement. The 50th percentile is the median, where half of all measurements are beneath and half of all measurements are above. The 90th percentile is the latency that 90% of all measured latencies are less than or equal to. It’s pretty cheap to measure histograms by using logarithmic bucketing to index into an array of buckets that are sized to be within 1% of the true observed values. The historian crate was extracted from sled to assist with these measurements in a super cheap manner.
Imagine this scenario:
- a front-end system sends 100 requests to a back-end system
- the front-end system is able to send each request in parallel
- the latency distribution for the back-end system is a steady 1ms until the 99th percentile where it jumps to 1s.
- the front-end system must wait for the slowest response before it can respond to the user
How long does the front-end system need to wait for?
The probability of needing to wait 1 second for a single request is 1% (99th
percentile is 1s). Pretending the distributions are independent, the
probability of needing to wait 1 second for 2 requests is 1.9% (1 - (0.99 ^
2)). Intuition: if we sent 1,000,000 requests, the percentage would not become
1,000,000 * 1%, or 10,000%, because 100% is the max probability an event can
have. For this example, everything between the 99th and 100th percentiles is
exactly 1 second. All of our slowest 1% of requests take 1 second.
The probability of needing to wait 1 second for 100 requests is 1 - (0.99 ^
100), or 63%. Even though the event only happens 1% of the time, our front-end
system will have to wait 1 second in 63% of all cases, due to needing to send
multiple requests.
Our systems are full of subcomponents that are accessed many times to satisfy a higher-level request. The more often something happens, the higher the percentile we should care about is. For many workloads, looking at the 100th percentile (max measurement) is quite helpful, even though it only happened once, because it can help to motivate capacity planning for other systems that depend on it.
Further reading:
productivity
 The computer is so powerful and so useful
 because it has eliminated many of the
 physical constraints of electromechanical
 devices. This is both its blessing and its
 curse: We do not have to worry about the
 physical realization of our software designs,
 but we also no longer have physical laws that
 limit the complexity of these designs—the latter
 could be called the curse of flexibility
 - Nancy Leveson, 1995
One of the most frequently overlooked performance metrics is the cognitive complexity of a codebase. If engineers experience high friction when trying to change a codebase, all efforts to make the code faster will be dramatically hindered. A codebase that is a joy for engineers to work with is a codebase that will see the most long-term optimizations. Codebases that burn people out will not see long-term success unless they receive tons of funding to replace people who flee the project after short periods of activity. Organizational instability is a high-quality predictive metric for the bugginess of a codebase.
Putting energy into reducing the complexity of your code will often make it:
- easier for humans to read (hence faster for them to optimize over time)
- easier for compilers to optimize due to being smaller
- faster to compile at all, resulting in a more responsive edit-measure loop, resulting in more optimizations per human time unit spent
- have less machine code, improving instruction cache at runtime (especially when running outside of microbenchmarks that conceal realistic cache effects)
“Experts write baby code.” - Zarko Milosevic
So, we must pick our meaningful metrics, measure them after considerate experimental design, make decisions while having these results at hand, and repeat.
Our unmeasured assumptions are incorrect. Optimizing without measuring is how you end up with unmaintainable codebases that have been inflicted by many displays of “performative-optimization” written with the metric of “demonstrates intellectual superiority” over metrics like “long-term collaborator happiness”.
Let’s strive to be clear about our metrics, at the very least.
sled case study
Here are some other metrics that are interesting for sled:
- Single operation worst case latency: this is our primary metric because we are prioritizing transactional workloads above analytical workloads. We want users to have reliably responsive access to their data. We pay particular attention to the very worst case latency because it is fairly important from an operational perspective. We sometimes choose to sacrifice better average latency in order to improve the latency at high percentiles, to increase the overall dependability of the system.
- Peak memory utilization: we want a high fraction of all allocated memory to be made up of user data that is likely to be accessed. This lets us keep our cache hit rates higher given the available memory, reducing the latency of more operations.
- Recovery latency. How long does it take to start the database after crashing?
- Peak memory throughput: we want to avoid short-lived allocations that may be more efficiently stored on the stack. This also allows us to have more predictable latency as our memory usage grows, because most allocators start to degrade in various ways as they are pushed harder.
- Bulk-loading throughput: we want users to be able to quickly insert large amounts of data into sled quickly so they can start using it.
- Peak disk space utilization: we don’t want sled to use 10x the space that user data requires. It’s normal for databases to use 1-2x the actual data size because of various defragmenting efforts, but we reduce the number of deployment possibilities when this “space amplification” is high.
- Peak disk throughput: there is a trade-off between new data that can be written and the amount of disk throughput we spend rewriting old data to defragment the storage file and use less total space. If we are careful about minimizing the amount of data that we write at all, we can increase our range of choice between smaller files and higher write throughput.
- Disk durability: the more we write data at all, the sooner our drives will die. We should avoid moving data around too much. A huge amount of the work of building a high quality storage engine boils down to treating the disk kindly, often at the expense of write throughput.
In sled, we measure histograms using code that was extracted into the historian crate. We also output a table of performance-related information when configured to do so. Having a profiler built-in makes finding bottlenecks quite easy, and in a quick glance it’s easy to see where optimization effort may be well spent.
experimental design
Experimental design is about selecting meaningful workloads and metrics, avoiding bias and achieving reproducible results without wasting too much time.
Simply measuring the runtime of a workload before and after applying a diff is unsound because there are so many other variables that impact performance.
Your machine does some things that might not be obvious, which will change your measurements:
- CPU frequency scaling
- CPUs will burst to high frequencies for short periods of time to make short tasks run quicker
- CPUs will lower their frequencies to use less power over time
- CPUs will lower their frequencies to generate less heat over time
- did better compilation cause your CPU to heat up? your better code may run slower afterwards
- is your laptop running on battery? better code may run slower
- is the data you’re reading from disk already in the OS pagecache?
- your kernel keeps a lot of recently accessed file data in memory to speed up future accesses
- the second run of a program that reads data from disk doesn’t pay the disk costs. better code may run slower than slower code with a warmed cache
- is your memory becoming more fragmented?
- The linking order used to combine otherwise identical compiled code objects when creating a binary
- can result in 10% more cycles with zero code changes. better code may run slower
- yelling near your computer
- having too much fun? better code may run slower
- If the kernel pulls your thread to a different socket than the one that
initially allocated a bunch of memory, the latency to keep accessing that
memory will increase by 60ish ns as requests need to be proxied through
the original socket.
- threads can be pinned to sets of cores on specific sockets to avoid being migrated to another socket.
If an experiment were a pure math function, changing our input variables would be the only thing that would influence the change of our observed outputs. Unfortunately, our systems are quite complex, and there are many factors which may influence the quality of our measurements.
Experimental design is at the heart of our quest to determine if our code changes made our system better according to our chosen metrics.
How do we measure our metrics? We seek to make our programs more efficient by changing code. Running a program twice will result in two different measurements. But the difference in performance is NOT necessarily because the code is faster for realistic workloads.
Many code changes that run faster in microbenchmarks will run more slowly when combined with real program logic because the microbenchmark is able to use a lot more CPU cache than it would be able to when running with a real workload.
You can think of this as being similar to the “multi-tenancy” performance issues that we struggle to deal with in distributed systems engineering. The same applies even more to single-threaded code which radically changes due to the amount of cache it has access to.
Very often, faster code is only faster for a few moments before it causes frequency scaling to kick in aggressively due to heat generation. There have been some infamous cases where using SIMD causes CPUs to heat up more, causing frequency scaling to kick in more, and result in a slower system when running for longer periods of time. Even without frequency scaling kicking in, faster code often consumes more heat, as well. Maybe a 3% throughput improvement is not worth a 100% power consumption increase.
Failing to exercise experimental discipline will result in a lot of “optimizations” that are assumed to improve the situation but in fact only add complexity to the codebase, reducing maintainability, and making it harder to properly measure future optimizations.
One of the most basic techniques: don’t just run a workload once:
Bad:
* time compile and run workload 1
* time compile and run workload 2
* compare total times
The above method is extremely common, especially by people changing code and running measurements on their laptops without disabling any frequency scaling features.
We need to be careful about being biased by the compilation itself. Frequency scaling can kick in when a compiler works harder to produce more optimized binaries. If the compiler worked much harder to produce a better binary, the CPU frequency may be lower and any subsequent measurements might be much lower. Faster code will appear slower.
Better:
* restart your system with `intel_pstate=disable` to linux kernel line.
* close slack. close your web browser.
* kill as many non-essential processes as you can get away with.
* if running a laptop, use the performance governor instead of powersave
  `for policy in /sys/devices/system/cpu/cpufreq/policy*; do echo $policy; echo "performance" | sudo tee $policy/scaling_governor; done`
* compile workload 1
* compile workload 2
* disable frequency scaling and turbo boost (after compiling, it will slow things down)
  * `echo 1 | sudo tee /sys/devices/system/cpu/intel_pstate/no_turbo`
* time workload 1
* time workload 2
* time workload 1
* time workload 2
...
* time workload 1
* time workload 2
* view distribution of results
* re-enable turbo boost for a less deterministic yet more enjoyable computing experience
  * `echo 0 | sudo tee /sys/devices/system/cpu/intel_pstate/no_turbo`
By running workloads interleaved with each other, we reduce the risk of having particular transient system-wide effects impact only a single measurement.
By taking multiple measurements, we improve our understanding of the distribution of possible results given our current configuration.
However, our goal is to increase the chances that we have established a causal link between our code changing and our desired metrics improving. There are many variables that we are always ignorant of. If we want to be more confident that our system is actually better, we can gather corroborating evidence that can help explain the measured effect.
There are a lot of things that happen in between your code changing and a timing metric changing. A compiler transforms the code into machine code. Machine code is linked together in a certain order (causing up to a 10% performance impact due to link order alone, see papers in the further reading section below). Then when we run the binary, we load the various code objects into memory at addresses which may be effected by ASLR, further introducing a considerable amount of variance. Anything that impacts memory layout could have a strong impact on the effectiveness of our memory caches, which use several heuristics to predict which memory you may access next, and these may be impacted by changes in physical memory allocation during the run of a workload. Your CPU will run when it has instructions and data to zip together, but it really spends a huge amount of time just waiting around for its dependencies to arrive. Whenever your instructions and data finally show up, your CPU will execute them in creative ways that are later verified to conform to the dependency structure communicated through the compiled machine code, although they are often thrown away due to finding out that some data dependency has changed because of what some other CPU core published to the shared cache coherency subsystem. Importantly, the CPU will update a lot of its own performance counters as these various operations occur.
For our intermediate memory statistics, allocators like jemalloc expose many metrics which can help us to explain changes in our measured resident set size.
Verifying that these intermediate metrics also change in significant ways can help us to increase our confidence in the causal link between changed code and changes in high-level metrics like overall workload throughput, high-level operation latency, overall process memory resident set size, etc… In general, the higher-level the metric, the more intermediate metrics may be helpful in attempting to account for the change. The more complex the system you’re changing is, the higher the chance of falling prey to omitted variable bias.
While running an experiment multiple times can help us account for variance, it cannot help us account for bias.
To reduce the likelihood that we are being impacted by bias, we must be conscious that bias is always present, and we must actively search for the truth. Funny enough, Knowing About Biases Can Hurt People, so if we are going to accept the presence of bias, we must actively take responsibility for countering it, or we may be even worse off than before we became aware of bias.
If you want to read more about personal debiasing, this book rules: Rationality: From AI to Zombies.
But for debiasing our experiments, we can seek corroborating evidence through intermediate and related metrics, as well as measuring possible alternative explanations for the high-level change and determining whether they may be the true explanation for the observed changes.
In addition to collecting runtime metrics while running our code in a more-or-less production configuration, we can also use tools like llvm-mca and cachegrind to estimate expected instruction and cache performance of our programs, and DHAT and massif to analyze our heaps. These tools do not run your program in a production configuration, but they still yield interesting metrics that may be used to increase confidence in an effort to influence a high-level metric.
Our CPUs expose a wide variety of performance counters that may also be sampled to compare against our other measurements.
experiment checklist
- p-state scaling may be disabled if using the intel_pstate driver by setting the
linux kernel boot command argument
intel_pstate=no_hwp - turbo boost can be disabled by setting
echo 1 | sudo tee /sys/devices/system/cpu/intel_pstate/no_turboif running with intel_pstate orecho 0 | sudo tee /sys/devices/system/cpu/cpufreq/boostif using acpi - pagecache can be dropped via
sync && echo 3 | sudo tee /proc/sys/vm/drop_caches(thanks @vertexclique) - system-wide memory can be compacted via
echo 1 | sudo tee /proc/sys/vm/compact_memory(thanks @knweiss)
Here are two nice checklists from Raj Jain’s The Art of Computer Systems Performance Analysis (Amazon Associate link which sends the sled project a kickback):
Box 2.2 Steps for a Performance Evaluation Study
- State the goals of the study and define system boundaries.
- List system services and possible outcomes.
- Select performance metrics.
- List system and workload parameters.
- Select factors and their values.
- Select evaluation techniques.
- Select the workload.
- Design the experiments.
- Analyze and interpret the data.
- Present the results. Start over, if necessary.
Box 2.1 Checklist for Avoiding Common Mistakes in Performance Evaluation
- Is the system correctly defined and the goals clearly stated?
- Are the goals stated in an unbiased manner?
- Have all the steps of the analysis followed systematically?
- Is the problem clearly understood before analyzing it?
- Are the performance metrics relevant for this problem?
- Is the workload correct for this problem?
- Is the evaluation technique appropriate?
- Is the list of parameters that affect performance complete?
- Have all parameters that affect performance been chosen as factors to be varied?
- Is the experimental design efficient in terms of time and results?
- Is the level of detail proper?
- Is the measured data presented with analysis and interpretation?
- Is the analysis statistically correct?
- Has the sensitivity analysis been done?
- Would errors in the input cause an insignificant change in the results?
- Have the outliers in the input or output been treated properly?
- Have the future changes in the system and workload been modeled?
- Has the variance of input been taken into account?
- Has the variance of the results been analyzed?
- Is the analysis easy to explain?
- Is the presentation style suitable for its audience?
- Have the results been presented graphically as much as possible?
- Are the assumptions and limitations of the analysis clearly documented?
Further reading:
- Five ways not to fool yourself
- Performance Analysis Methodology
- How Not to Measure Computer System Performance
- Producing Wrong Data Without Doing Anything Obviously Wrong! - ASPLOS 2009
- ASPLOS 13 - STABILIZER: Statistically Sound Performance Evaluation - ASPLOS 2013
concurrency and parallelism
- parallelism is when a task may execute independently of other things
- concurrency is when a task may be paused until some dependency is satisfied
This concurrency definition may feel a bit strange to most people. After all, isn’t concurrency when we are spinning up lots of things that will run at once, like a new thread or async task?
When we describe our concurrent programs, we are usually writing a lot of code that relates to finding out what happened somewhere else, getting some information from another place or another task, maybe blocking on a channel or a socket, or writing some information to a different place. But usually, this means that we need to block until some activity outside of our local control finishes. Blocking until the kernel can write our data into a socket, blocking until some other thread pushes an item into a queue that we’re receiving from, blocking until all 5000 servers have finished counting the occurrences of the trending term “hand sanitizer” from user activity logs in the past 24 hours, etc…
When we talk about concurrency, we’re talking about suspending our execution until various dependencies are satisfied. It’s kind of declarative, in that we describe our dependencies, and then we expect an external scheduler to ensure that our code will run when our dependencies are met.
Parallelism is sort of the opposite, in that it is when things can run at the same time due to not having dependencies which are unmet. It implies more flexibility for your schedulers, because they can just run your code without worrying about satisfying dependencies in some order. But it’s more restrictive for the programmer, as they must write their task in such a way that it is able to make progress independently of other tasks. This is simply not possible for many types of problems, like cryptographically hashing a number 4000 times - as each subsequent round requires the previous one to complete first.
However, if we are able to write programs such that multiple tasks that can make progress independently of each other, it is possible to schedule them (if system resources are available) to run at the same time, thus reducing overall execution time.
Parallelism vs concurrency is a trade-off between:
- scheduler flexibility vs human flexibility
- independence vs potential blocking on dependencies
- imperative vs declarative
One insight is that a sequential, single-threaded execution can be placed squarely in the middle of parallelism and concurrency in each of the above trade-offs.
While some schedulers may be able to run concurrent tasks in parallel when they are known not to have any sequential dependencies, the high-level approach is already starting at a conservative point that prevents common techniques like optimistic non-blocking algorithms from better taking advantage of the parallelism that our hardware could provide us with.
Over time, our hardware is becoming much more parallel - more CPU cores, more memory channels, more parallel GPU circuitry, etc… And if we want to take advantage of it, we simply must write programs that can make progress on multiple system resources in parallel.
For a video that goes into the parallelism vs concurrency design space, check out a few minutes after 8:18 in this presentation:
CppCon 2019: Eric Niebler, David Hollman “A Unifying Abstraction for Async in C++”
If you have high costs associated with putting work back together, or associated with contending on a resource (too many threads for your cpus, mutexes, etc…) then your parallelism gains will be negatively impacted. So, to properly take advantage of parallelism, we must minimize the amount of work we spend waiting for a shared resource, and blocking on other tasks to complete, or paying costs of merging parallel work together. Less sharing at all means more throughput because things can run independently of each other. sled tries to share very little across requests for this reason.
amdahl’s law
Amdahl’s law is a tool for reasoning about the potential speedups that a workload can achieve through parallelization. Some tasks must be executed serially, and will see no benefit from parallelization. Calculating the result of cryptographically hashing a number many times must be performed serially (ignoring rainbow tables for this example), because each step requires the output of the previous step, and it cannot begin until that result is known.
Calculating the result of multiplying and dividing many numbers with each other is completely parallelizable because we can start operating on sub-arrays of arguments, and then combine the results at the end.
Fun fact: our CPUs aggressively predict inputs to operations and start executing their results before knowing if the guesses are correct. The better we can predict inputs, the more we can speculatively execute results in parallel. Margo Seltzer has given some great talks on a project to take this concept much farther than would seem plausible.
There are sometimes parts of our programs that can be parallelized, while others must be executed in a serial fashion. Amdahl’s law shows that throwing more resources at a workload will not usually cause that workload to complete in a proportional fraction of time.
The main takeaway:
- only part of a program can be sped up through parallelization
universal scalability law
The USL is an excellent way to reason about the potential gains (or negative impacts) of concurrency. It goes farther than Amdahl’s law because it starts to be able to describe how concurrency can start to introduce significant negative costs due to the work that must be done by virtue of making a workload concurrent at all.
The USL describes two costs associated with adding more concurrency to a workload:
- contention - the amount that more concurrent work leads to more waiting for shared resources like a mutex, disk head, CPU core, etc…
- coherency - the amount that costs must be paid to reassemble or block on other work as the amount of concurrency increases in the system
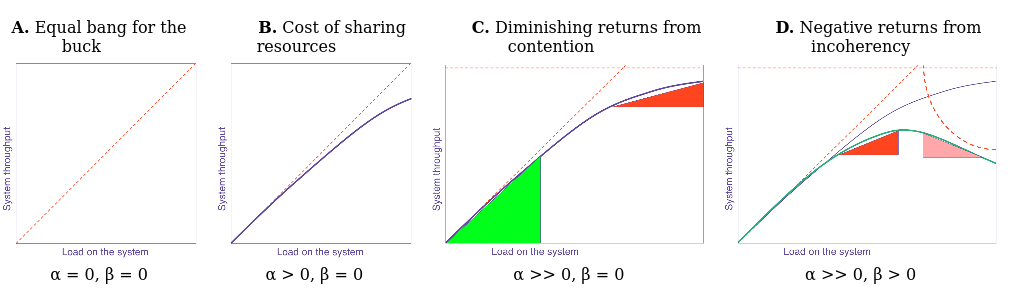
The USL shows that concurrency can reduce possible gains of parallelism by introducing contention and coherency costs. Contention is effectively the part of the program that Amdahl’s law describes as being non-parallelizable. Coherency is the cost of putting it all back together.
Frank McSherry showed that a single laptop running a properly tuned single-threaded implementation can outperform the throughput of an expensive cluster for several graph processing algorithms by completely avoiding the massive contention and coherency costs that such distributed systems must pay.
Further reading:
trade-offs
the RUM conjecture
When designing access methods for data structures, databases, systems, etc… there exists a 3-way trade-off:
- read overhead
- update overhead
- memory (space) overhead
By choosing to optimize any 2 of the above properties, the third one tends to suffer. The way that they suffer can be thought of through either contention or cohesion costs.
Let’s apply this to an in-memory ordered map:
- R + U: here, we can trade higher space usage for cheap reads and writes. An immutable, purely-functional tree allows readers and writers to work without contending on a mutex, and space may never be reclaimed.
- U + M: we trade slow reads for fast writes and low space. A tree where tree nodes are represented as a linked-list of updates applied to a base node. Writers may simply attach an update to the head of the linked list representing the node. Readers must scan through the list and replace it with a compacted version, freeing the space used by the previous updates and base node, and removing any outdated versions / deleting items that had a tombstone placed in the update list. Readers pay compaction costs, writers proceed quickly.
- R + M: we trade slow writes for fast reads and low space. This is effectively how classic B-tree databases often work. Writers must take out a lock to update the tree node, and pay the costs associated with cleaning up outdated state. Writers can perform their operations in ways that are more expensive for the writer, but allow readers not to block at all, such as multi-version concurrency control. However, effort needs to be spent (by the writers in this case) to keep overall space usage low and perform more eager garbage collection work to remove unnecessary old versions.
There are many ways to push this work around to achieve desired properties, and we can generally be pretty creative in how we do so, but we can’t be absolutely optimal in all 3 categories.
This trade-off was introduced in the paper Designing Access Methods: The RUM Conjecture and Mark Callaghan frequently writes about applying these trade-offs in what he calls “database economics” where decisions can be made to optimize for various properties at the expense of others.
In Mark’s writings, he uses slightly different terminology, and also introduces a few other trade-offs that impact database workloads:
- read amplification - how much work a read request performs
- write amplification - how often data is rewritten to keep overall space low
- space amplification - how much extra space is used
In many database designs, you can trade write amplification for space amplification fairly easily by throttling the amount of effort spent performing compaction/defragmentation work. By compacting a file, you are spending effort rewriting the data in order to make the total space smaller.
This also has storage endurance implications where we reduce the total lifespan of the device by performing more writes over time.
Mark also introduces the concept of cache amplification, which he describes as the amount of in-memory overhead there needs to be in order to service one read request with at most one disk read.
Another look at these trade-offs has been presented in the paper The Periodic Table of Data Structures.
memory pressure vs contention
Contention can be caused when multiple threads are trying to access a shared resource, such as some state that is protected by a mutex or a reader-writer lock. In many cases, it’s possible to reduce contention by spending more memory.
For example, we can remove the requirement to have readers take out locks at all by having any thread that acquires the mutex first make a local copy, perform its desired changes on the local copy, and then when finished swap an atomic pointer to install their update. Readers may follow this pointer without ever acquiring a lock first. In this case, we will do a new allocation each time we want to modify the data. But for read-heavy structures, this technique can keep a system running without needless blocking. Care needs to be used to avoid destroying and freeing the previous version while readers may still be accessing it, either by using a garbage collected language, atomic reference counters, or something like hazard pointers or epoch-based reclamation.
In Rust, we have the
Arc::make_mut
method which will look at the reference count, and either provide a mutable
reference (if the count is 1) or make a clone and return a mutable reference to
that. We can use a RwLock<Arc<T>> to get a mutable reference to the Arc,
and either apply mutations without blocking existing readers. This “snapshot
readers” pattern is another point in the contention-memory pressure spectrum.
Readers take a reader lock and clone the Arc before dropping it, giving them
access to an immutable “snapshot”. Writers take a writer lock and call
Arc::make_mut on it to then mutate the Arc that exists inside the RwLock,
blocking the next group of readers and writers until its mutation is done.
The compiler will make all kinds of copies of our constant data at compile-time and inline the constants into code to reduce cache misses during runtime. Data that never changes can be aggressively copied and cached without fear of invalidation.
speculation
While things like speculative execution have gotten kind of a bad rap due to Spectre and other CPU information leak vulnerabilities that relate to it, optimistic and speculative execution is fundamental for many areas of systems programming. It shows up in many places in our operating systems, browsers, standard libraries, etc… Ubiquitous lock-free algorithms that power our queues rely on this heavily.
There are two forms of speculation:
- predictive execution: instead of spending the (often high) cost for acquiring exclusive access to a resource or knowing with certainty about some outcome, we just make a guess that our desired outcome will happen, and we find out later on if it was a correct bet or not. This bet makes sense when the cost of being wrong about the bet times the chance of being wrong about the bet is lower than the cost of acquiring exclusive access or determining some outcome with certainty first on every request.
- eager execution: perform an operation based on every possible input to the computation. Later on, when the actual input is known, just choose the result that you already computed. This sounds kind of absurd, but Margo’s linked talk above shows that this can really be pushed far in some situations.
In general, it’s more common in software to write code that is predictively speculative. Lock-free algorithms often make a bet about the current value of a pointer, perform some work, and then use an atomic compare-and-swap (CAS) operation to try to mutate the shared pointer to a new modified value if the predicted previous value was properly guessed. If some other thread changed the pointer already, the guess about the previous value will be incorrect, and the operation will either retry using the new value or it will fail.
Speculation is a key tenant in taking advantage of parallel hardware, because it lets us make bets about contention and possibly throw work away if our bet didn’t pan out.
Most modern databases are usually designed to perform transactions using Optimistic Concurrency Control. Rather than taking out locks for items involved in a transaction, OCC avoids locks but performs a validation step before committing the transaction to check whether other transactions have interfered. The assumption is that for many workloads, transactions tend to operate on non-overlapping data. Validating the correctness of a transaction does not require using locks, either.
Using the framework of the USL, OCC trades blocking contention of acquiring locks pessimistically for the coherency costs of performing validation without blocking. A single-threaded database can avoid both of those costs, but if you want to scale your system beyond a single thread, you will need to perform some form of concurrency control anyway.
auto-tuning speculation
However, you can build databases to be auto-tuning and avoid any concurrency control as long as only a single thread is running, and “upgrade” the system dynamically when the database is being accessed by multiple threads by re-configuring the concurrency control configuration, and then waiting for any threads operating under the old configuration to finish their tasks to avoid conflicts. The sled database allows lock-free single-key operations to avoid performing any concurrency control usually, but as soon as a single multi-key transaction happens, it re-configures the system to perform concurrency control for all operations. This embodies the philosophy of “pay for what you use” and avoids paying concurrency control costs for operations that only require single-key linearizability, rather than serializability.
Speculation can cause wasted work to happen if the bet being made tends not to result in less overall work. For example, if 10,000 threads are all trying to do a compare and swap on a single item in a tight loop, it will result in only a single one of those threads ever succeeding after reading the last successful value, and all of the other threads failing to make any progress despite doing work. In this case, it may make more sense to just take out a mutex and prevent all of the other threads from needing to throw a lot of work away. We can use cheap thread-local variables for tracking contention, and fall-back to more pessimistic execution techniques when contention is measured to result in a lot of wasted work.
fairness
In the above example with 10,000 threads in a CAS loop on a piece of memory, there is a significant chance to introduce unfairness where only a single thread tends to be winning the CAS loops. This is because it takes time for updates to memory to propagate to other cores and sockets, and the core where the last change happened is the one with the most up-to-date cache. It has a significant head-start compared to other threads that need to wait for this propagation latency before being able to make a bet in their own CAS attempt.
This is said to be unfair because most threads will see very little progress, but the previous thread to “win” gets a higher chance to keep winning. This can lead to starvation where some threads are unable to make as much progress.
This has implications for mutexes, among many other things. Modern mutex implementations tend to implement some sort of fairness-mechanism to combat this effect. It can actually be quite expensive to have a mutex be completely fair, as it requires maintaining essentially a FIFO queue that mediates access, and bending on the FIFO property can lower the effort of using a mutex, which reduces contention and overhead. So, fairness can be expensive. But you can use tricks to get some fairness for a very low price. For instance, the parking_lot crates implements an idea called “eventual fairness” where fairness measures are taken occasionally, which adds a very low amount of overhead while achieving a useful amount of fairness in many situations.
Combating starvation is also a vital aspect of a high quality scheduler.
scheduling
This section is essentially about multiplexing. Sometimes we want to share some physical or logical resource among multiple computational tasks. Maybe we want to run multiple operating systems, processes, threads, or async tasks on a single CPU. Or maybe we want to multiplex multiple data streams on a single TCP socket. Maybe we want to map some set of files or objects onto some set of storage devices.
Our ability to map the appropriate tasks to appropriate computational resources will determine how effectively that task can do its job of transforming its own computational dependencies into its computational results.
key terms:
- over-subscription
- interactive workloads
- batch workloads
Ultimately, if we want to do more work, we can either make our work more efficient for getting more done on the computational resources we already have, or we can figure out a way to run our work on more hardware. In cases where additional computational resources (CPUs, GPUs, disks, memory, etc…) are available, it often makes sense to figure out how to use them rather than trying to figure out how to better use existing ones.
In Parallel Disk IO, Dmitry Vyukov goes into some nice things to keep in mind while building a scheduler. In general, you should be mindful of the way that work is queued up in your system, because using things like FIFO queues will guarantee that cache locality gets worse as the queues fill up. Using a stack instead of a FIFO will generally help to improve cache locality for both work items and threads that are woken to perform work.
Crucially, Dmitry points out that work should be prioritized in a way that is mindful of the state of completion of a particular task. If you are building a service that responds to requests, you probably want to prioritize work in this way:
- first run things that are ready to write, as they signify work that is finished
- things that are ready to read, as they are work that has been accepted and the timer is ticking for
- only accept based on a desired queue depth based on your latency/throughput position. If you care about latency above everything, never accept unless all writes and reads are serviced and blocked. If you care about throughput above all else, you want to oversubscribe and accept a lot more work to reduce the frequency that your system bottoms out and has no work to do. You don’t want to accept work that you’re not servicing though if latency is a priority, and you want a smaller TCP backlog that will fill up and provide back-pressure for your load balancer so it can do its job.
The general idea is to keep the pipeline busy, but favoring work toward the end of the pipeline as they will free resources when they complete, reducing overall system load and increasing responsiveness by reducing queue depths.
In Task Scheduling Strategies, Dmitry mentions some trade-offs between work-stealing and other approaches.
Work stealing is when threads have their own work queues, but they will try to steal work from other threads when they run out of work to do. This imposes coordination costs because threads need to synchronize access to their queues with threads that may steal from them. It also imposes cache locality hits because it might take work from a thread with the data in a closer cache and forces a stealing thread to pay more cacheline retrieval costs to work with the stolen data.
Dmitry recommends that most general-purpose schedulers use work-stealing due to the downsides being not too bad in most cases, but he points out that in some situations where you are scheduling small computational work (cough cough Rust async tasks) you may want to use an Erlang-style work-balancing strategy that has perfect knowledge of the progress that various threads are making, and from a centralized position performing re-balancing work.
There are also two other forms of work balancing:
- work requesting is when a thread that runs out of work makes a request to a thread with work to give it over. This allows threads to avoid synchronizing access to their own queues, which can significantly speed up their own consumption. But it increases the latency that threads sit idle before having work given to them by the threads with excess work. And it imposes some extra work on the giving side at the time of hand-off, which may or may not be worse than the consumption benefits, depending on the workload.
- work balancing is when you distribute work onto a set of threads that may not have enough work to do.
In scheduling research, there is a quest to try to build systems that are able to make the best decisions for various workloads. It is not possible to build a scheduler that is optimal for all use cases. There are many latency-throughput, contention vs space, fairness, centralized optimality vs distributed throughput trade-offs to be made.
If you want to dig in deeper, this distributed scheduling paper made a lot of waves in 2016 and comes to some nice conclusions: Firmament: Fast, Centralized Cluster Scheduling at Scale.
scouting ahead
One of the most important lessons that pilots learn is to make decisions based on the readings from their flight instruments. Humans are surprisingly poor judges of issues like “which direction is the ground” especially when flying at night and in storms. Learning to trust the readings of the instruments is vital for staying alive over many flights in varied weather situations.
Programmers often don’t do this. We tend to make random guesses based on some primitive feeling, resulting in months or years lost pursuing the impossible over the course of a career. But our machines are quite amenable to measurement, and we can avoid wasting so much of our lives by paying better attention to metrics that are easy to acquire before spending time optimizing something that isn’t a problem to begin with.
Many potential optimizations can take hours or weeks of coding and refactoring before you can get the system to a place where you can perform any measurements at all. Sometimes you have a strong hunch, or sometimes you have 5000 engineers whose time you don’t respect, but in any case, sometimes optimizations take a lot of effort. Fortunately, there are a lot of techniques available to us for avoiding performing work that will be thrown away, and in the process, increasing the amount of respect we can show ourselves and our teammates by not asking them to do impossible things.
Here are three techniques that can provide evidence that may help to inform high quality decisions about where engineering effort may be spent with a higher chance of success before just jumping into a suspected optimization somewhere:
- flamegraphs
- deletion profiling
- causal profiling
flamegraphs
Flamegraphs are useful for visualizing the costs associated with specific code locations by showing the expense in terms of visual area. They are a good “first glance” at where a program may be spending a lot of time, instructions, or some other measurable resource but there are a number of caveats that come with their interpretation, and you should only use them as a kind of flashlight that may illuminate where specific costs are arising in code. In many cases, they will not show costs associated with time spent off-cpu waiting for blocking IO etc… so you need to be mindful of this, or use a tool that specifically supports off-cpu profiling.
I’ve already written a bit about them on the flamegraph-rs/flamegraph README (scroll down for a guide on how to use them).
It’s important to note that you can associate a variety of different kinds of costs with code using flamegraphs, including allocations, off-cpu time, branch mispredictions, cache misses, etc…
I also strongly recommend checking out KDAB/Hotspot for both generating and visualizing perf data. It has a nice UI and may be preferable for some users to the above flamegraph utility.
Personally, I frequently use a mix of the above flamegraph tool, hotspot, and
perf report directly in the terminal, depending on the kind of visualization
I am trying to generate.
Also see Brendan Gregg’s page on flamegraphs. He has probably done more than anyone in recent years to help people to better understand their system’s performance. His book Systems Performance: Enterprise and the Cloud is also extremely high quality, especially chapter 2: Methodology.
deletion profiling
This is one of my favorites because it’s so easy when it’s applicable. Just comment out some function call that you are curious about the cost of and see how much faster the program runs. If it’s not any faster, it doesn’t matter how much you improve it, you will never be able to match the benefit of completely deleting it (assuming it doesn’t get compiled away anyway). Don’t spent time speeding up code that does not contribute to the overall cost.
causal profiling
Causal profiling is kind of the opposite of deletion profiling. Instead of deleting code, it adds delays in different places to see how much worse the overall runtime is. Unlike deletion profiling, it doesn’t potentially break the program by using it, and it can be widely employed to find opportunities for tuning things.
Coz is one of the best-known implementations of it. There is also support for rust, which was upstreamed after beginning in alexcrichton/coz-rs.
Using these profilers and others like DHAT, massif, cachegrind, etc… will show you where you may stand to benefit from additional optimization effort.
Remember, profiling tends to rely on sampling techniques that are quite lossy. Use profiling to find optimization targets, but then rely on a variety of correlated metrics to gain confidence that your changes are actually improving the performance of the system instead of just shifting effort into a blind spot of the profiler.
that’s it for now
This guide has touched on a variety of techniques, theories, models, and mindsets that have proven to be invaluable while writing sled and working with a variety of other stateful systems.
The most important thing is to ask yourself what really matters. Your time is precious. Try to give yourself high quality information, and base decisions on the estimated expectation that they may help you with what matters to you. We are wrong about everything to some extent, but at least when we work with computers we usually have a variety of measurement techniques available. We can perform lightweight experiments to feel out the potential impact of longer-term engineering efforts. One of the most important aspects of some of these ideas is that they illuminate the “negative space” that is unlikely to be possible without extreme expense. Gaining confidence in potential positive impacts before investing significant effort is ultimately about respecting yourself and your teammates. Be considerate.
If you found this article to be useful, please consider supporting my efforts to share knowledge and productionize cutting edge database research with implementations in Rust :)